SARS-CoV-2 Update for Feb 21st
The pandemic continues to rapidly decelerate but absolute numbers remain higher than either the spring or summer waves. While optimistic, continued decreases are not guaranteed.
The Counterpoint is a newsletter that uses both analytic and holistic thinking to examine the wider world. My goal is that you find it ‘worth reading’ rather than it necessarily ‘being right.’ Expect regular updates on the SARS-CoV-2 pandemic as well as essays on any and all topics (first one premiering next week). I appreciate any and all sharing or subscriptions.
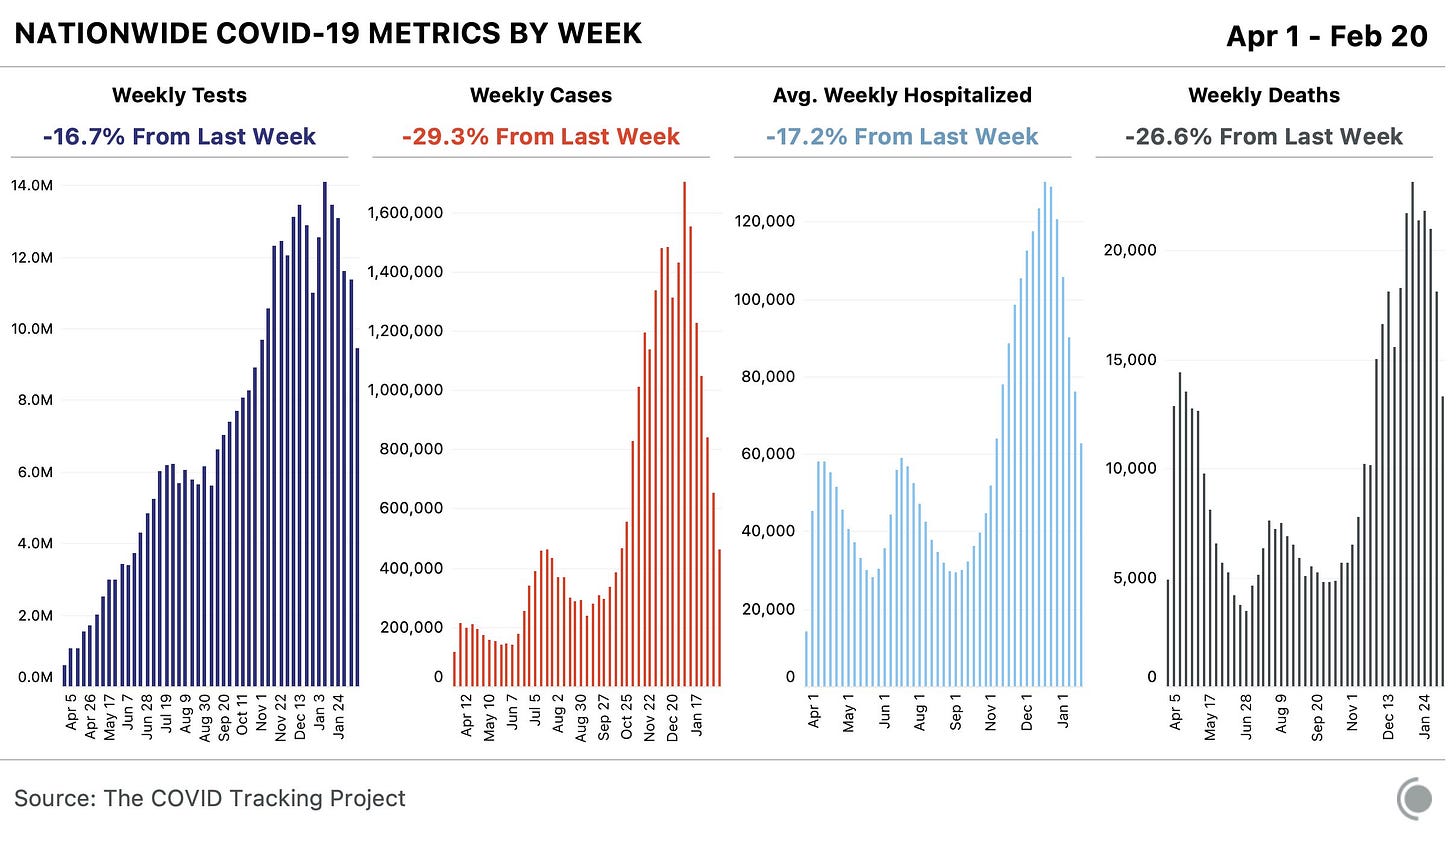
The pandemic continues to improve both globally and within the United States. Case counts, hospitalizations, and deaths are all declining (below) while vaccine distribution and dosing continues to scale. Moreover, our ability to treat COVID-19 continues to improve, more vaccines are in the authorization process, and plans to increase manufacturing for already-authorized vaccines are being implemented.
But an improving situation doesn’t necessarily mean a great situation. It is simultaneously true that “hospitalizations and deaths are down by ~50% from peak” and “hospitalizations and deaths are as high or higher than the first and second waves.” Both absolute levels and rates matter when assessing a situation. 2,000 Americans dying from COVID-19 per day should be unacceptable regardless of which direction the trend is.
That being said, given our collective decisions throughout 2020, the 2021 landscape is about as optimistic as could be desired. There will be more than a few books written about the United States’ numerous and significant failures throughout 2020. However, those failures did not stop the development and authorization of multiple highly effective vaccines, on the order of ~95% for Pfizer and Moderna and ~66% for Johnson and Johnson. These numbers represent each vaccine’s ability to prevent symptomatic disease. More importantly, all available evidence continues to suggest that the vaccines are 100% effective at preventing hospitalization and death. The real world data from Israel, the country that is leading (by far) in vaccination rate, speaks for itself (below).
In addition to being efficacious, these vaccines are incredibly safe. While many people experience minor side effects (pain in arm, fever, lethargy, etc.), the most common serious side is allergic reaction. “Common” is used liberally, as there were 66 confirmed cases of anaphylaxis after the first ~17.5 million doses of the Pfizer and Moderna vaccines, or ~0.0004% (exact breakdown below). Of these 66, zero died.
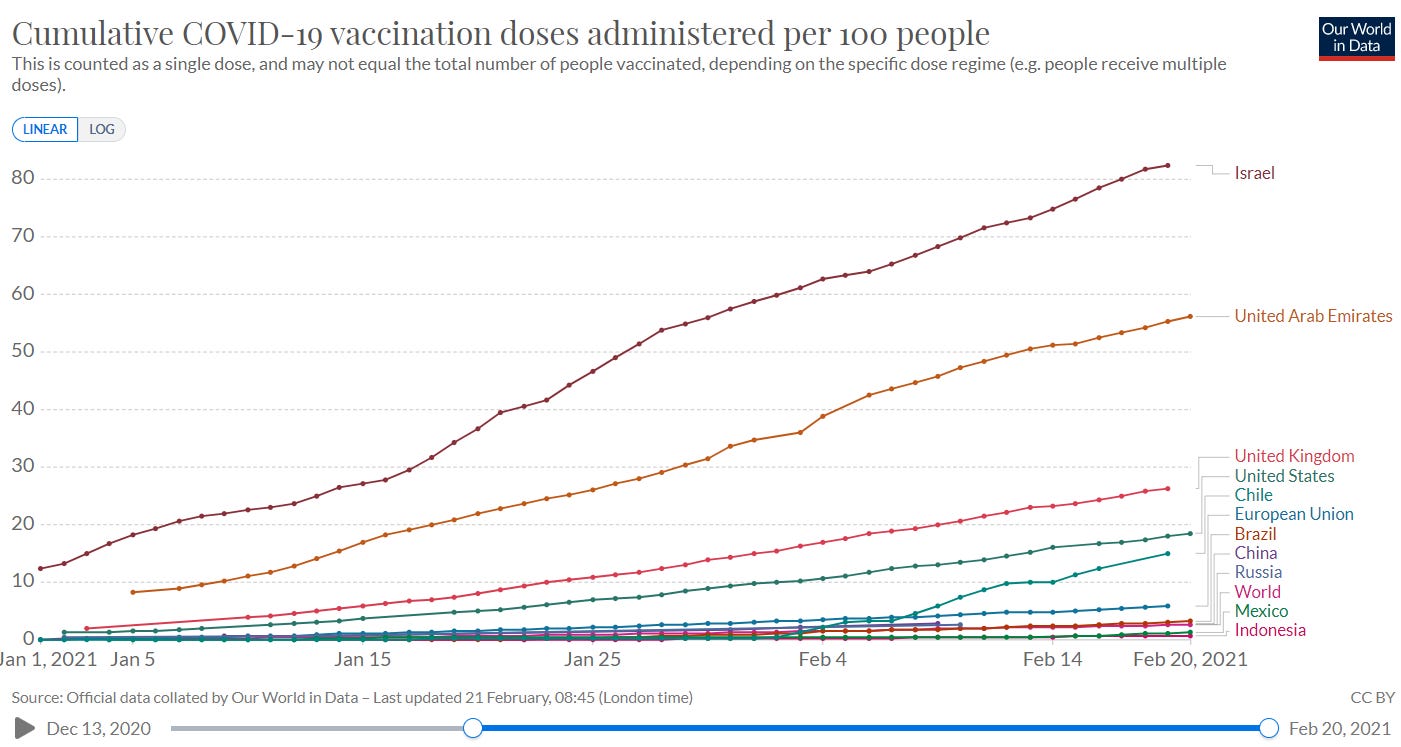
The development of safe and effective vaccines doesn’t mean much if you cannot distribute and dose them. Fortunately, the United States continues to a global leader in vaccination (below). The Trump administration deserves credit for developing and initiating Operation Warp Speed. The Biden administration deserves credit for continuing to accelerate vaccine distribution and securing 200 million additional doses.
Prior success in vaccinations now means a current strain on supply. While this is a very good problem to have, it is still a problem. We are administering faster than distributing resulting in a record low vaccine reserves (doses distributed minus doses administered). Using the seven-day average for daily vaccinations, it would take ~10 days for those reserves to run out (below, bottom), should no more be manufactured and distributed. In total, 75.0 million doses have been distributed and 61.3 million doses have been administered, for a record high administration rate of ~82% (below, top).
Current projections have all adult Americans vaccinated by June 2021 (below). This timeline assumes Johnson and Johnson receives authorization (highly probable), continued manufacturing and supply improvements by Pfizer and Moderna (uncertain to probable), and no vaccine hesitancy from significant portions of the population (unlikely to uncertain). As clear a goal as ‘scaling vaccine supply’ is, it’s incredibly difficult. Producing kilograms of mRNA (tens of micrograms of mRNA per dose x millions of doses per day = kilograms of mRNA per day) is no easy feat, let alone preparing and mixing it the handful of other ingredients in the vaccines, followed by injecting it in millions of vials, all done at cold temperatures in complete sterility with only pharmaceutical-grade materials (including the glass in the vials). The engineering and manufacturing throughout this process is significantly advanced, which limits scalability.
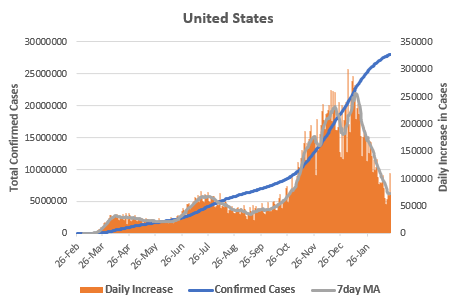
There have been 28,078,822 confirmed cases of COVID-19 in the United States. After peaking at 256,517 on January 12th, the seven-day average for daily cases has fallen to 71,783, the lowest since late October. I’m not aware of any person that predicted such a precipitous decline (myself included!). Why have cases declined so rapidly?
In one sense, we know the answer: the average infectious person is infecting less than one other person. The average number of secondary infections that a primary infected person causes is called the “reproduction number,” or R(t). When R(t) > 1.0, the number of newly infected people grows, when R(t) < 1.0, the number of newly infected people decreases. Below is the map of currently estimated values of R(t) for each state (credit to Epiforecasts).
But this simply pushes the real, causal question back one step. If cases are declining because R(t) < 1.0, why has the average infected person been infecting less than 1.0 other persons?
Imagine there were 101 people on a football field with exactly one of them being infectious with SARS-CoV-2. How many other infections will that one infectious person cause?
If that is all the information provided, then we’d just be blindly guessing. To make an accurate prediction, we’d need more information. Is the infectious person wearing a mask? Are the other people wearing a mask? How closely is everyone standing? How long are they on the field together? Have any of the 100 been previously infected? What direction is the wind blowing? What is the temperature and humidity? Etc.
The point is that R(t) is influenced by multiple factors, all of which are pushing it either upward or downward.
Some of the factors decreasing R(t) include the increasing number of Americans with immunity (whether from infection or vaccination), seasonality effects from changes in temperature and humidity, and continued mask wearing, physical distancing, and other public health measures.
Some of the factors increasing R(t) include the continued spread of more transmissible varaints such as B.1.1.7 (whose exponential spread within the United States is shown below) and continued increasing in travel, in-person dining, and other sectors of the economy as ‘re-opening’ continues.
If we want to see continued case declines within the United States, then we need to ensure that the downward forces on R(t) continue to ‘win.’ It is within the realm of possibility that the upward forces may win out again (picture a colder spring with a large number of spring break travelers to Florida, where B.1.1.7 is becoming increasing dominant). It is also within the realm of possibility that downward forces continue to reign supreme (most risk-takers have already been infected and the remaining cautious and uninfected individuals continue to take public health measures seriously while vaccine distribution and administration scales).
The point is that any decline in case counts doesn’t necessarily continue to zero. If we want to ‘crush the curve,’ it is more important we continue to wear masks and take seriously other public health measures. With millions being vaccinated daily and warmer months just around the corner, we can have a “A Quite Possibly Wonderful Summer.”
Finally, a quick overview of the regular numbers not covered yet.
The positivity rate continues to decline and is nearing all-time lows.
Hospitalizations and ICU admissions have declined to roughly their spring and summer peaks. There are currently 58,222 Americans hospitalized with COVID-19 and 12,120 in the ICU.
There have been 497,670 confirmed deaths from COVID-19 in the United States. This number should be considered a minimum (see total excess death trackers at The Economist, The New York Times, or this pre-print on Medrxiv). Daily deaths are finally starting to decrease. The seven-day average for daily deaths is below 2,000 for the first time in months.
Our rough heuristic for total population immunity suggests ~114 million Americans possess immunity against SARS-CoV-2.
Finally, the latest update on our current knowledge of the main variants, courtesy of Dr. Eric Topol.
If you enjoyed The Counterpoint, please share, subscribe, or comment below.


