SARS-CoV-2 Update for March 7th
The 'meta-game' remains the same: vaccines vs variants, reviewing February predictions, and a final update on certain intra-US statistics
The Counterpoint is a newsletter that uses both analytic and holistic thinking to examine the wider world. My goal is that you find it ‘worth reading’ rather than it necessarily ‘being right.’ Expect regular updates on the SARS-CoV-2 pandemic as well as essays on a variety of topics. I appreciate any and all sharing or subscriptions.
The ‘meta-game’ remains the same: vaccines vs variants. As discussed in the Feb 21st update, whether or not cases continue to decrease depends solely on keeping R(t) < 1.0. Multiple forces influence R(t) either upwards to downwards, with the most important being vaccines (constant downward pressure) and variants (constant upward pressure). Seasonality (downward pressure, in the Northern Hemisphere) is another factor that should not be ignored.
The downward forces continue to dominant within the United States. Cases continue to fall while vaccinations continue to scale. The situation remains incredibly optimistic but this path was not and is not guaranteed; we must remain vigilant with our public health measures and individual choices.
The current situation in Europe is what happens when variants take hold. B.1.1.7, aka the ‘United Kingdom’ variant, is much transmissible (and suspected to be more lethal) than the ‘original’ strain of SARS-CoV-2. First detected in the United Kingdom, it spread to both Ireland and Spain before renewed public health measures were put in place. Being more transmissible, the variant caused truly massive wave winter waves (I won’t include here, but check daily case curves in both the United Kingdom and Ireland for jaw-dropping graphs). The delay in detection meant that the variant was probably in most European nations and that a waves were building. Now, those waves have arrived all across Europe. Below is the biweekly change in case counts; essentially all of Europe is red besides the above listed countries that already had their B.1.1.7 wave. (Notice that most of the rest of the Northern Hemisphere is seeing declines, while much of the Southern Hemisphere is seeing increases.)
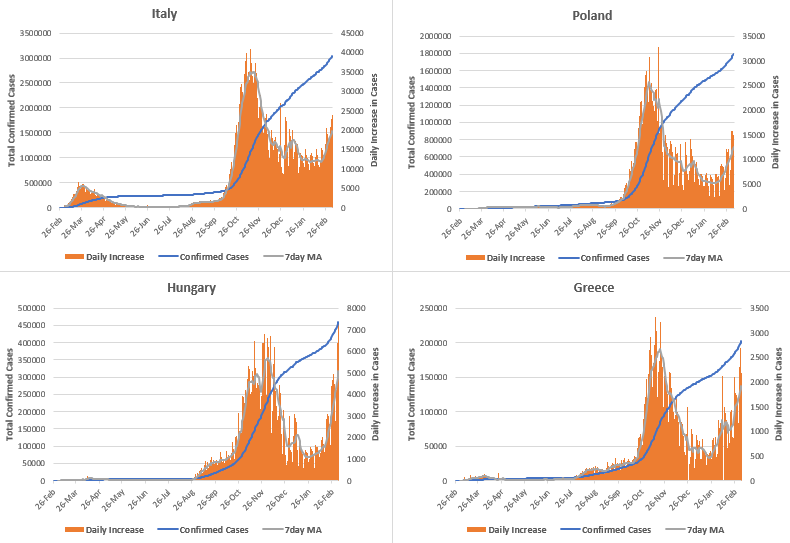
Below are the country specific graphs for Italy, Poland, Ukraine, and Greece. The present waves are quite large despite all of these countries being incredibly hard hit (read a substantial proportion of the population bearing immunity)!
This is what makes Texas’ and Mississippi’s decisions to remove state-mandated public health restrictions so maddening: we aren’t out of the woods yet! To reiterate, I’m optimistic about the situation and believe that the situation in the United States will improve. But B.1.1.7 continues to spread within the United States and is becoming an increasingly larger proportion of positive cases tested (below). We do not want to become like Europe! Now is the time to truly ‘crush the curve,’ with a few more weeks of strict public health measures while vaccination continues to scale!
Even if Texas and Mississippi don’t start another wave, it doesn’t mean it was a good decision. “Resulting” is when you base the quality of a decision on the quality of the outcome, especially when the stakes of being wrong are high. ~85% of Russian Roulette players survive but that doesn’t mean it is a smart game to play. We’ve seen above what happens when B.1.1.7 gets out of control and even if the risk is small, it is not a risk worth taking.
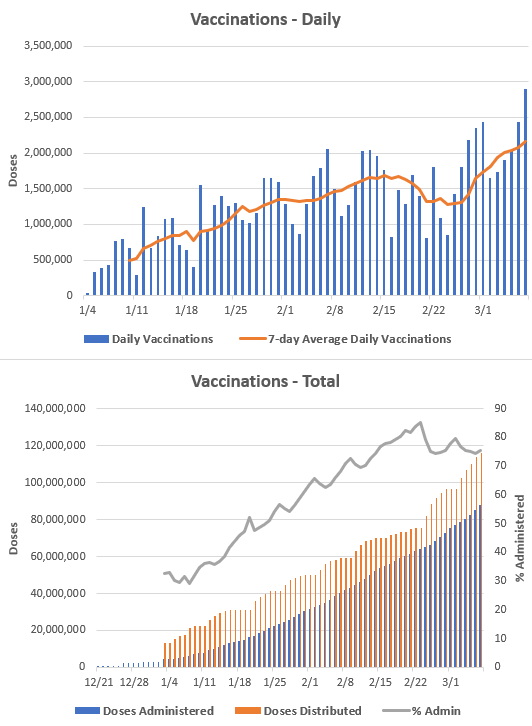
The main reason for optimism within the United States is that vaccinations continue to scale. The seven-day average for daily vaccinations is 2.16 million shots per day! Bloomberg estimates that 17.3% and 9.0% of Americans have received their first and second doses, respectively. Over 116 million total doses have been distributed and 88 million have been administered.
In the Feb 21st update, we had a supply problem. This has now been completely eliminated. But that means we have a dosing problem! There are currently 28.4 million doses that have distributed but not administered. States should be loosening vaccination requirements; we need to be getting these shots in arms!!! Even with the record-high rate of daily vaccinations, we have 14 days of vaccination supply, should no further doses be distributed.
A simple model suggests that ~131 million Americans have immunity to SARS-CoV-2. Moving forward, this model will not work as well, now that the Johnson & Johnson is out there being dosed and only requires a single shot. (Immunity via vaccination is just total doses administered divided by 2).
Reviewing February Predictions
On Feb 1st, I predicted that at the end of February, there would be 28,710,000 confirmed cases and 516,000 confirmed deaths from COVID-19 within the United States. On the morning of March 1st, there were 28,606,340 confirmed cases and 513,092 confirmed deaths.
While our simple heuristics for estimating cases and deaths were incredibly accurate this past month, it is not lost on me that February is also the shortest month. It may very well have been simply ‘less time to become wrong’ that provided such accuracy. March will be a test for our heuristics.
For cases, I predict 29,750,000 total confirmed cases at the end of March. This is a simple trend model that starts the month at 400,000 weekly cases and ends the month at 200,000 weekly cases.
For deaths, I predict 546,500 total confirmed deaths at the end of March. Our rough heuristic is that confirmed deaths lag confirmed cases by 21 days and with a CFR of 1.7%. There were ~1.55 million cases in the final 21 days of February, suggesting 26,417 deaths through March 21st. Estimate another 7,000 for those final ten days of March, for a total of 33,417 March deaths, or ~546,500 total confirmed deaths.
Today was the last day of intra-United States data collection from The COVID-19 Tracking Project. We should all applaud their efforts as they fulfilled an essential and critical role, simple data collection, that at the beginning of the pandemic, the federal government did not want to take on.
Though there are now other sources and methods of my collecting this data, I will also stop with much of this data. Virus updates will continue! But as stated above, the ‘game’ is different than what it was throughout 2020. Test positivity rates, etc., aren’t as important as they were. I will continue to track total country numbers, vaccination numbers, and broader trends, but this will be a last hooray for many of these charts (below) that hopefully you recognize.
Testing in the United States remain inadequate! The situation is obviously much improved with the positivity rate now ~4%. I would’ve enjoyed seeing the US hit <1.0% (as other countries have), but oh well.
There are 40,212 Americans hospitalized with COVID-19 and 8,137 in the ICU. Yes, this numbers have dropped, are dropping, and more than likely will continue to drop. But it is important to remember that these are numbers that would’ve deeply scared us a year ago.
Deaths lag ICU admissions by ~14 days. By following national ICU numbers, one can predict deaths.
The case fatality rate in the United States is 1.79%. All evidence suggests the true infection fatality rate is ~0.6%.
If you enjoyed The Counterpoint, please share, subscribe, or comment below.


