No, Long COVID Doesn't Affect 25% of Kids
Thoughts on "Long-COVID in children and adolescents: a systematic review and meta-analyses"
The Counterpoint is a free newsletter that uses both analytic and holistic thinking to examine the wider world. My goal is that you find it ‘worth reading’ rather than it necessarily ‘being right.’ Expect regular updates on the SARS-CoV-2 pandemic as well as essays on a variety of topics. I appreciate any and all sharing or subscriptions.
Let me be clear: Long COVID is a post-viral syndrome that affects millions of Americans. It manifests in a variety of ways and can often be severe and debilitating.
The point of this series is that it does not affect several tens of millions or even the >100 million Americans that some common estimates would imply.
This newsletter will look at Long COVID in children. A follow up on Long COVID in adults will be forthcoming.
On June 23rd, “Long-COVID in children and adolescents: a systematic review and meta-analyses” was published in Nature Scientific Reports. It combined the results of 21 studies and estimated the prevalence of Long COVID to be 25.24%.
This study spread rapidly around social media, with posts from Dr. Eric Topol, Dr. Eric Feigl-Ding, Dr. Jonas Kunst, Dr. Gunhild Alvik Nyborg, and many others.
Unfortunately, it’s a bad meta-analysis.
By “bad,” I mean that its included studies severely limit any conclusions that can be drawn from it. Moreover, analyzing the higher-quality studies within the meta-analysis directly undermine the headline conclusion.
A meta-analysis is when researchers combine the results of many independent studies that look at the same phenomenon. By combining the results from multiple studies, the impact of any biases and confounds within each of the individual studies is reduced. Ideally, this leads to a result that is not only closer to the true answer but also with less statistical error. When meta-analyses pool high-quality studies, they are considered the gold standard of evidence in scientific research.
But what is critical to understand is that just because something is a meta-analysis doesn’t mean it is reliable. Pooling low-quality or biased studies doesn’t suddenly make the overall analysis better just because the population is broader or the statistics tighter. This is a situation where ‘a bad apple spoils the whole bunch.’
When researchers perform a meta-analysis, they first set inclusion criteria. These are reasonable standards that each individual study must meet in order to be included in the overall analysis.
For example, since the meta-analysis being discussed is about Long COVID in children and adolescents, one of the inclusion criteria is that the age range for each individual study needed to be between ages 0 and 18. Any study that does not meet all inclusion criteria is excluded.
In this paper, the researchers show this process in Figure 1 (below). After all screening and exclusion, there were 21 studies that meet the inclusion criteria and were included in the meta-analysis.
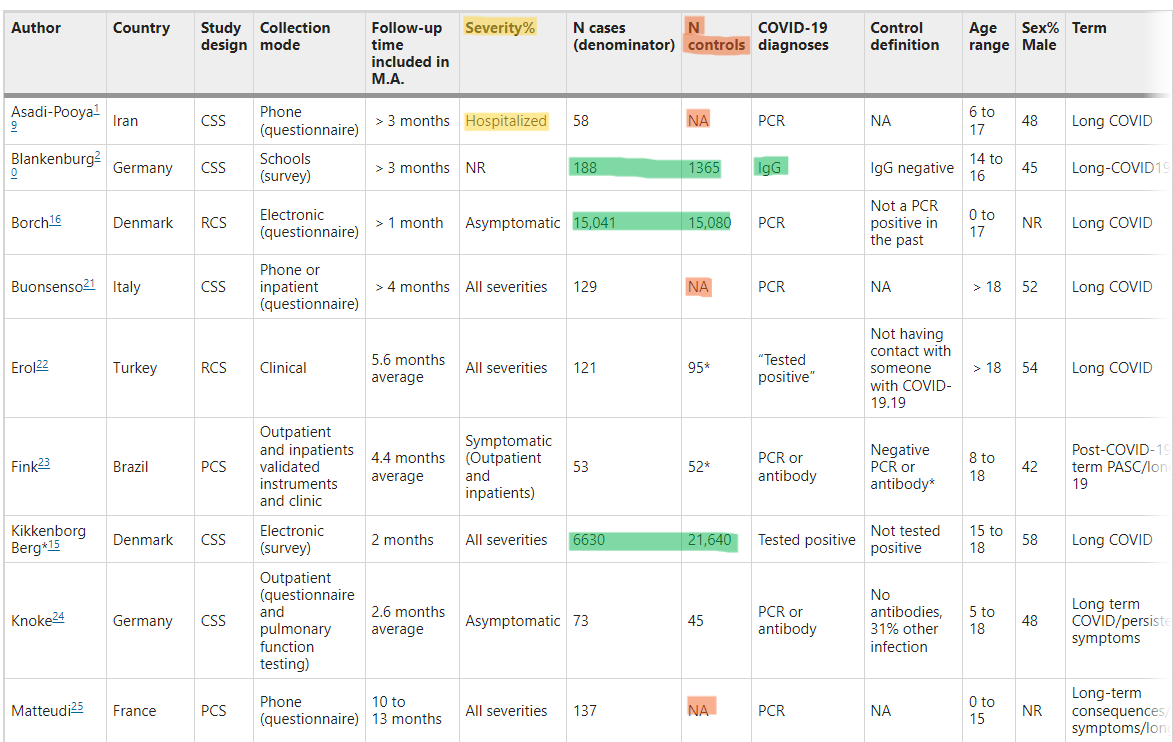
It’s typical for researchers to generate a table summarizing each of the individual studies. These researchers did so in Table 1 (below, highlights mine).
This is where the red flags occur. Notice the “Severity” column; five of the individual studies are of only hospitalized patients (yellow highlights). Notice the “N controls” column; ten of the individual studies don’t have any controls (orange highlights).
Phrased another way, ~50% of the studies in this meta-analysis don’t have controls and ~25% are of only hospitalized patients. These are low-quality and biased studies that skew the meta-analysis toward severity.
What really undermines the results of the meta-analysis are some of the studies within the meta-analysis. These studies are the highest-quality studies within this meta-analysis (highlighted in green).
First, each of these five studies have controls. Controls are critical for measuring the real effect of something. For example, neurological issues (such as fatigue, anxiety, depression, etc.) can be symptoms of Long COVID. However, they can also be symptoms of living through a bad or stressful situation (such as a global pandemic that closes schools and potentially isolates children from their friends). Without controls, it is impossible to determine the true cause of an outcome.
Second, are the three largest studies (Borch et al., Kikkenborg et al., and Roessler et al.). These three studies have over 30,000 patients each (as opposed to the less than 100 in others). While size alone does not guarantee a high-quality study, it is suggestive, as the larger a study is, typically the less bias and confounds there are since more of the population is studied. To take it to the extreme, the hypothetical ‘best’ study of childhood Long COVID is the one that studies every single child in the entire world. Obviously, this isn’t possible, so researchers are forced to study smaller populations and use statistics to model how likely their results are to be true.
Three, are the two studies that use antibodies, and not PCR, to identify infected children (Blankenburg et al. and Radtke et al.). We've known that throughout the pandemic, both asymptomatic illness and access to testing have been issues when trying to identify cases. Requiring a positive PCR test to be included in a study means that there is likely a cohort of children that were CoV-2 infected but excluded from the infected group. This skews the infected group toward severity, since more severe cases are more likely to have been tested. Using serology instead of PCR is a more accurate measure for sorting patients into “infected” and “non-infected” groups.
It is these five studies that directly undermine the “25.24% of children have Long COVID” conclusion of the meta-analysis. None of these five studies find a prevalence that high. In fact, they all report a prevalence much, much lower.
Let’s look at the three largest studies.
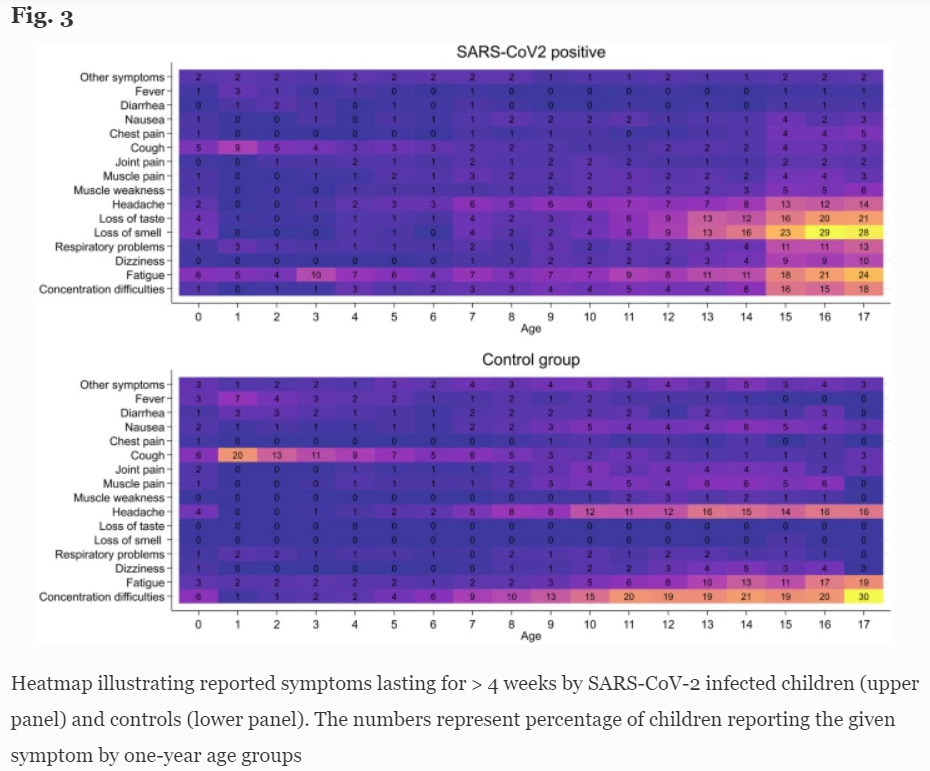
Borch et al. ~15,000 infected and ~15,000 controls
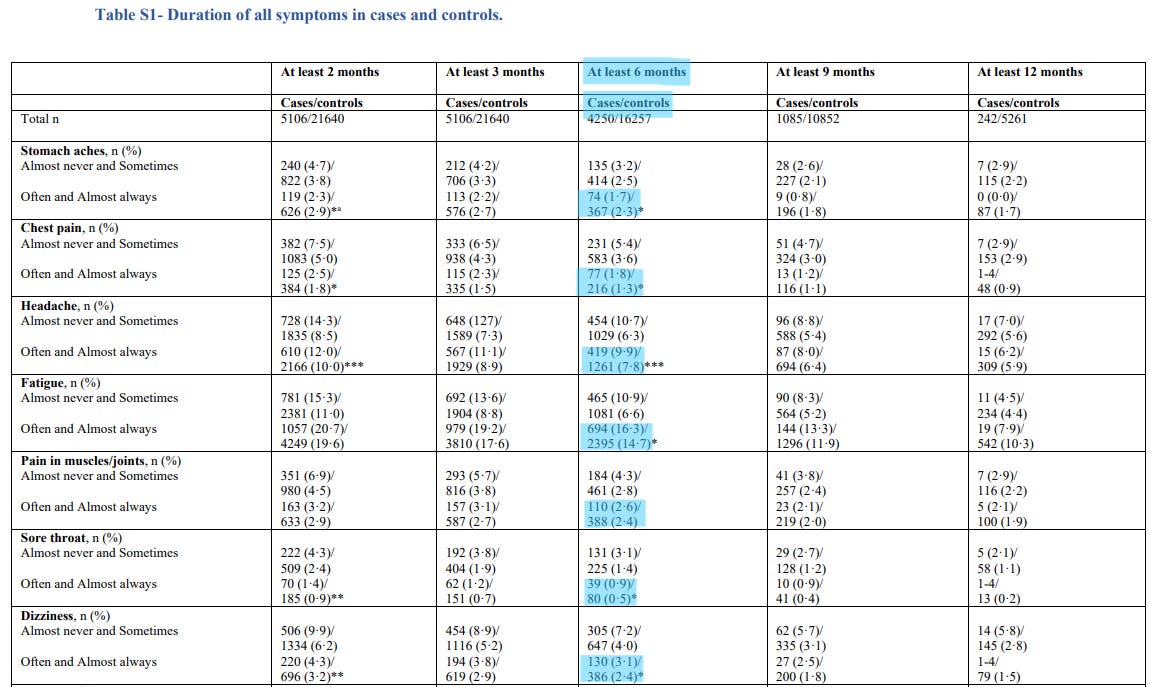
Kikkenborg et al. ~6,600 infected and ~21,000 controls
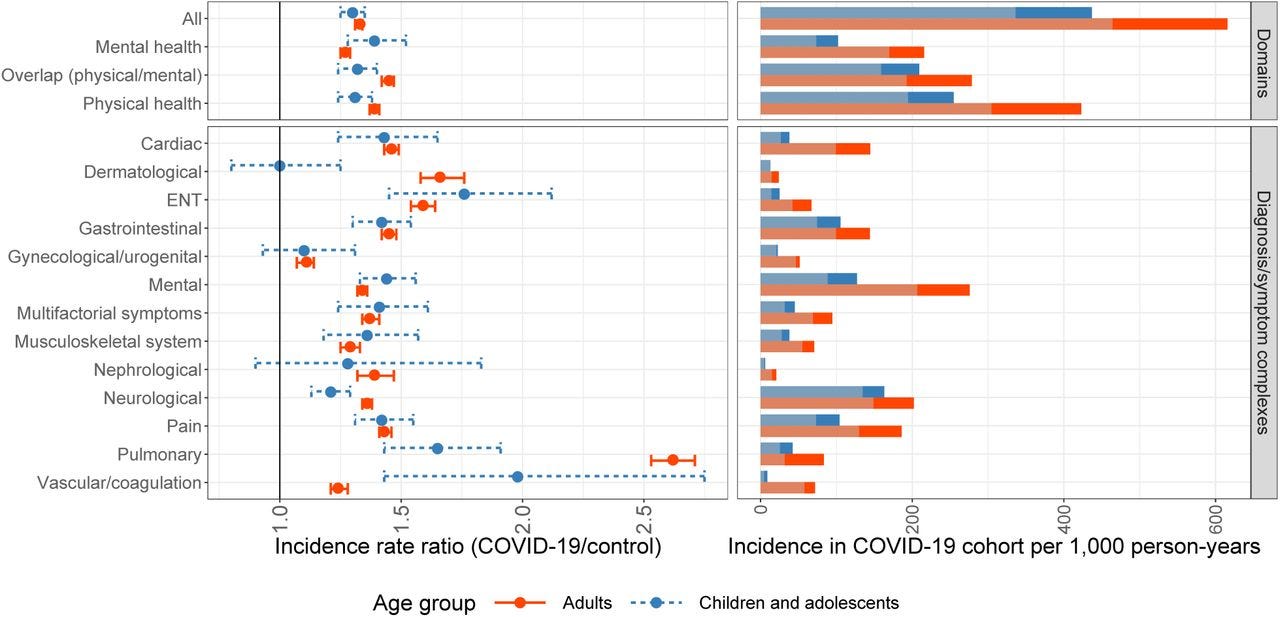
Roessler et al. ~58,000 infected and ~289,000 controls.
Borch et al. found a 0.8% difference in reported symptoms lasting >4 weeks between the CoV-2 positive and control groups (28.0% and 27.2% respectively). They conclude “Long COVID in children is rare and mainly of short duration.” Below is a heatmap illustrating the prevalence of symptoms by age.
Kikkenborg et al. found a 4.9% difference in symptoms lasting at least two months between the CoV-2 infected and control groups (61.9% and 57.0% respectively). Below is a portion of Supplementary Table 1, showing the duration of symptoms for cases and controls. I’ve highlighted the “at least 6 months” column, specifically the percentage of cases and controls that report each symptoms “often and almost always.”
Roessler et al. found a 10.1% difference in health outcomes between CoV-2 children and controls (437 per 1000 person years and 336 per 1000 person years, respectively). Figure 1, showing the incidence for only the COVID-19 cohorts is below, right.
Next, let’s look at the two studies that used antibodies to establish CoV-2 infection.
Blankenburg et al. ~200 cases and ~1,400 controls.
Radtke et al. ~100 cases and ~1,200 controls.
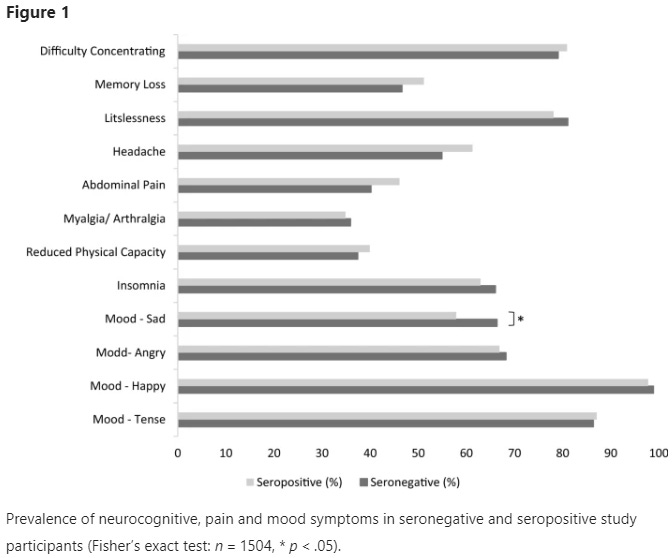
Blankenburg et al. found “with the exception of seropositive students being less sad, there was no significant difference comparing the reported symptoms between seropositive students and seronegative students.” Note that this study looked at only neurological, mood, and pain symptoms.
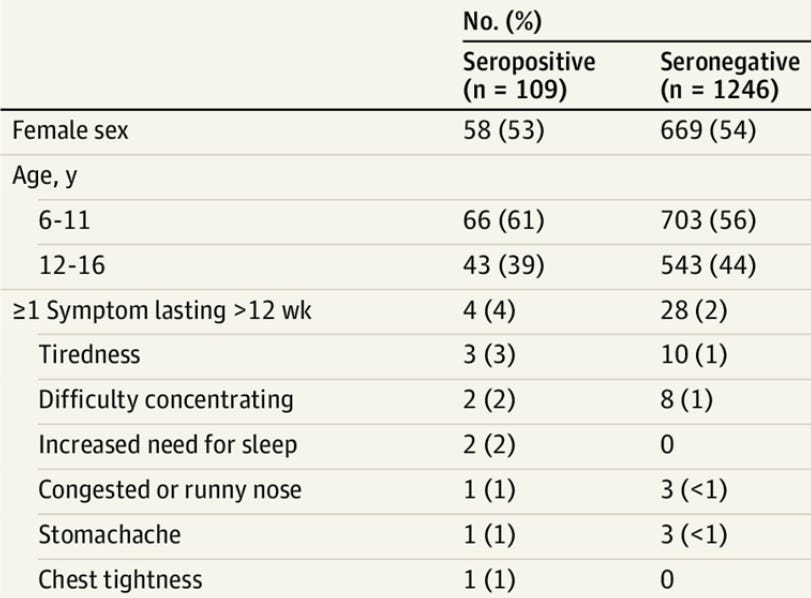
Radtke et al. found a 2% difference in reported symptoms lasting >12 weeks between seropositive children and seronegative children (4% and 2%, respectively).
To recap, a widely circulated meta-analysis concluded that the prevalence of Long COVID in children was 25.24%. However, if you look at the 21 studies included, ~50% are uncontrolled and ~25% are of hospitalized children.
Moreover, if you look at the largest and controlled PCR studies and the medium-sized and controlled serology studies, you find prevalences that are much, much lower: 0.8% (Borch), 4.9% (Kikkenborg), 10.1% (Roessler), no difference (Blankenburg), and 2% (Radtke).
Finally, I will link a separate prospective study published last week, “Post–COVID-19 Conditions Among Children 90 Days After SARS-CoV-2 Infection.”
Prospective studies are generally considered higher-quality than retrospective studies since they follow a cohort forward through time, rather than look backwards on a set of data or attempt to have patients recall information.
This study also had a very high follow-up rate (nearly 80%) which is much more respectable than the follow up rates of even the above mentioned studies.
This prospective study found a 1.5% difference in any reported persistent, new, or recurring health problem between non-hospitalized CoV-2 infected children and controls (4.2% vs 2.7%, respectively). Likewise, it found a 5.2% difference in the same measure between hospitalized CoV-2 infected children and controls (10.2% and 5.0%, respectively). This information can be found in Table 3.
In “Pandemic Lesson #2: The Complexity Ocean,” one of the complexities of the modern world that I listed was the “production, dissemination, and interpretation of scientific knowledge.” Quite often, the science is more complex/limited/intricate/considered/etc. than the headlines or tweets make it out to be. This is a point I tried to make in “Thoughts on "Outcomes of SARS-CoV-2 Reinfection"” and now this newsletter.
In summary: the prevalence of Long COVID in children is not 25%.


