SARS-CoV-2 Update for August 9th
An update on the current wave in the US, true Long COVID is uncommon in the general population, advances in Long COVID research, and what will steady-state CoV-2 look like?
The Counterpoint is a free newsletter that uses both analytic and holistic thinking to examine the wider world. My goal is that you find it ‘worth reading’ rather than it necessarily ‘being right.’ Expect regular updates on the SARS-CoV-2 pandemic as well as essays on a variety of topics. I appreciate any and all sharing or subscriptions.
The current situation in the United States
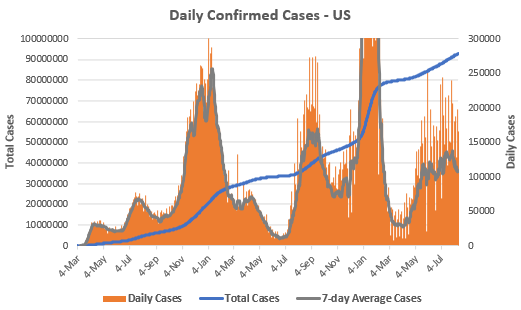
The seven-day average of daily cases is 107,516. This number continues the rough oscillation between 90,000 and 130,000 daily cases that has occurred since May 16th, nearly three full months.
The true level of infection is certainly far higher. This has been an issue throughout the pandemic because of both asymptomatic illness and inadequate testing, but undercounts have been magnified during both Omicron waves by the availability of at-home rapid tests. However, there are signs that this wave has peaked, with both daily confirmed cases and viral loads in wastewater dropping continually for over two weeks.
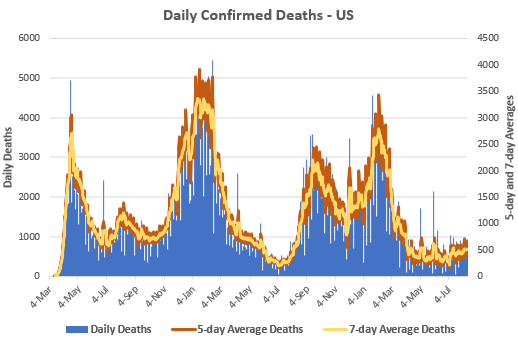
Despite the large wave of cases, our immunity wall holds strong. The seven-day average of daily deaths is 500. While this reflects a very slow but steady increase since the spring nadir, other than June and July 2021, it remains near the lowest number of deaths since the beginning of the pandemic.
However, these low levels should still be considered incredibly elevated. Yes, April through July 2022 was the fewest deaths of any four month period of the pandemic. But 49,119 died in those four months, or ~147,400 annualized, and that assumes no winter wave. This is an incredibly high level of mortality.
The total confirmed American death toll stands at 1,036,919. This number does not include unconfirmed COVID-19 deaths, subsequent morbidity from other diseases following severe COVID-19, or the long-term damage for those that suffer from Long COVID.
The majority of the damage from CoV-2 could be avoided with proper levels of vaccination. Despite multiple studies consistently showing high levels of additional protection from 4th doses (below), according to the CDC’s vaccination tracker, only ~26% of senior citizens and only ~11% of those 50-64 years old have received a second booster. Up-to-date vaccination is the single best action that one can do to reduce all negative outcomes from CoV-2 infection.

While this wave started in early April with the rise of Omicron BA.2.12.1, it has been steadily displaced by Omicron BA.4 and BA.5. From the CDC’s variant tracker, these two strains represent 93.2% of current cases in the United States. The CDC has also started to break out BA.4.6, a ‘new’ strain that has actually been circulating for several weeks. While unclear, the current data suggest that it is only outcompeting BA.4 and not BA.5. Another strain to watch is BA.2.75; again early evidence suggests it will not outcompete BA.5. Omicron BA.5 will likely remain the dominant variant for at least the near-future.
Long COVID is uncommon in the general population
In the newsletter on childhood Long COVID, I mentioned that I was working on a newsletter about adult Long COVID. In short, the thesis of the newsletter was that due to uncritical and poor interpretations of the research, most discussions on social media and the news vastly overestimate the incidence and prevalence of Long COVID in the general population.
Well, Dr. Gideon Meyerowitz-Katz beat me to the punch in an excellent Medium post last week. He concludes, “it’s probably somewhere around 1–10% of people who get infected, potentially less.” If you follow me on Twitter, I’ve been saying 1-5% (and probably at the lower end of that) since the beginning of the year.
Dr. Meyerowitz-Katz’s essay states most of what I wanted to say (seriously, read it!) but I’ll add a few more high-level comments:
Long COVID vs. Long Recovery vs. Organ Damage
Long COVID is a post-viral syndrome of unknown etiology. Since we do not understand the exact underlying disease(s), we currently assess it through symptoms that last more than four weeks after infection. This causes most Long COVID research to conflate several different things.
The first conflation is Long COVID and ‘Long Recovery.’
Let me analogize: If you pull a hamstring, it will take several weeks to fully recover. If you tear an ACL, it will take nearly a year to fully recover. Likewise, if you come down with a common cold, it will take several weeks to fully recover. If you come down with COVID-19, it will take…
COVID-19 is much more serious than a common cold and it can take much longer to recover. Just because you are having symptoms for six, twelve, or eighteen weeks after infection, doesn’t necessarily mean you have developed a chronic post-viral syndrome. The odds are that you’re just still recovering.
In “Thoughts on "Outcomes of SARS-CoV-2 Reinfection,”" we discussed how even in those that were re-infected, they were still showing signs of significant recovery at six months post-infection. This months-long recovery is consistent in the literature. If a ‘Long COVID’ study is assessing symptoms before six months, many of those patients will go onto full recovery and they do not have a chronic post-viral syndrome.
What is especially puzzling about the CDC’s choice to define Long COVID as symptoms that last >4 weeks is that the ME/CFS, the quintessential post-viral syndrome, requires symptoms for at least six months.
The second conflation is Long COVID and Permanent Damage.
SARS-CoV-2 can infect numerous different tissue types. When our immune system responds to a virus, it has mechanisms to identify and kill infected cells. Especially in severe disease, this can lead to a large loss of cells across various organs. Because of this, it is no surprise that large studies have found that CoV-2 infected individuals (mainly those that developed severe COVID-19) are much more likely to develop numerous cardiovascular problems, diabetes, and other diseases.
These are very real and unsurprising findings. But cellular damage to organs that makes one more vulnerable to other diseases is different than developing a wholly separate chronic post-viral syndrome. For example, it is well-established that influenza, which can infect cardiovascular tissue, plays a causal role in some amount of cardiovascular disease, especially atherosclerosis. But atherosclerosis isn’t post-viral influenza. It is a wholly separate disease process that exploited the damage left behind by the viral infection.
To be explicit, Long COVID, Long Recovery, and Organ Damage are all very real phenomenon. I’m doubting neither their existence nor damage. But we must be clear when discussing complex matters. When most people say/hear “Long COVID,” I believe that they mean/understand it to be the chronic post-viral syndrome version (i.e. severe fatigue, brain fog, no respiratory capacity, etc., etc.) not ‘I had a lingering cough for two months’ or ‘I developed an unknown rash five months after my infection’ or ‘my risk of developing diabetes went up by 1.4%.’
And post-viral syndromes, including Long COVID, are uncommon in the general population.
Real-world data and Long COVID
Last Friday, the monthly jobs report data was released and the US economy added 528,000 jobs while the unemployment rate fell to 3.5%. One other notable thing about the report is that the total number of workers surpassed the pre-pandemic peak (below).

Additionally, while the number of people with disabilities has been trending upward throughout the pandemic, the increase is slight, from 9.3% in Feb 2020 to 9.8% today.

The point of these charts is that there is no real-world data to suggest that a double-digit, or even high single-digit, percentage of Americans are suffering from a new chronic post-viral syndrome.
The default position
Post-viral syndromes are very real and have been chronically ignored and underfunded by the medical establishment.
The quintessential post-viral syndrome is myalgic encephalomyelitis/chronic fatigue syndrome (ME/CFS); it affects under 1% of people globally.
Earlier this year, a groundbreaking paper was published that convincingly argued that Epstein-Barr virus (EBV) was the cause of multiple sclerosis (MS). Despite EBV infecting >95% of people, MS affects under 1% of people globally.
Until the invention of a vaccine, poliomyelitis (polio) infected nearly ever human. ~70% of people were asymptomatic, while ~30% of people developed mild symptoms. In some cases, the virus spread to the nerves and caused paralysis; this occurred in ~1% of cases.
The point of these examples is that ME/CFS, MS, and paralytic polio are all serious and chronic post-viral syndromes. They also affect <1% of people. Our default position should’ve always been that chronic post-viral syndromes after CoV-2 infection occurs in ~1% of cases. Suggesting that Long COVID occurs in 10% of the general population is a truly extraordinary claim (let alone that 30%+ claims that are common) and extraordinary claims require extraordinary evidence. No such evidence exists.
Advances in Long COVID research
This week, a team led by Dr. Akiko Iwasaki published what is currently the broadest and deepest research into the underlying cause of Long COVID. This research has laid major groundwork for future scientific and clinical endeavors. If you like heavy science, the paper is absolutely worth reading. If you’d like a general breakdown, Dr. Iwasaki herself did a Twitter thread on it. This is an extraordinarily high level of science. All of the authors deserve praise.
Also this week, Nature Magazine published a piece on the dozens of treatments currently in clinical trials for Long COVID. If you or someone you know suffers from Long COVID, it may be worth it to keep an eye on these trials, discuss them with your physician, and it might even be possible to seek enrollment in one of the trials.
What will steady-state CoV-2 look like?
‘Cold and flu’ season is a well-established phenomena where respiratory viruses, including the four ‘common cold’ coronaviruses, circulate in the Northern Hemisphere during the winter but are close to non-existent during the summer. Yet this is now the third year in the row with a large wave of CoV-2 infections during the summer in the United States.
2020 and 2021 are easy enough to explain; most people hadn’t been infected yet. But after the Omicron BA.1 wave in winter 2021/22, the vast majority of people have now been both infected and vaccinated. Yet here we are in summer 2022 with another large wave of cases. What’s going on?
Dr. Trevor Bedford explored this in a recent Twitter thread.
In epidemiology, the reproduction number, or Rt, is simply the average number of future cases caused by the average infected person at a given time. If Rt > 1, then the number of cases will increase and if Rt < 1, then the number of cases will decrease.
Many forces impact Rt, such as the inherent biological properties of the pathogen, the local environmental conditions, the behavior of population, and the strength of population’s ‘immunity wall.’ Rt isn’t constant because all of these forces continually change: pathogens evolve, the seasons change, populations mix differently depending on the time of year, and immunity to many pathogens wanes.
But at the meta-level, the biggest influence on Rt is the size of the susceptible population. With the vast majority of humans having been infected by CoV-2, susceptibility will now depend on two main variables: waning of immunity and viral evolution.
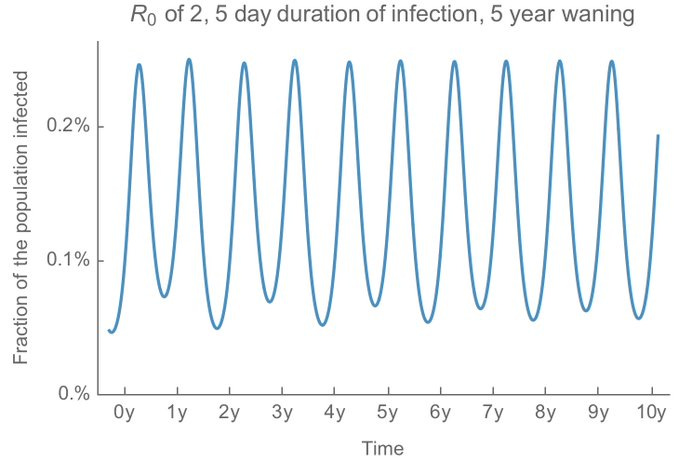
Dr. Bedford modeled a few scenarios of this. Take influenza, which has a R0 (the Rt in a hypothetical fully susceptible population) of ~2, patients are infectious for around five days, and assume that our immunity to it wanes over five years. With those assumptions, you get the below pattern of annual infection, replicating the pattern seen in the real world: large winter peaks followed by minimal summers.
But CoV-2 is more transmissible than influenza, with an estimated R0 of ~8. Moreover, infections typically last longer. Inputting those factors and dependent on the speed of immune waning, the epidemic curves would look like this:

The point being that, while cases should always peak in the winter (because seasonality), if our immunity wanes fast enough, there could still be meaningful levels of CoV-2 infection during the summer (red and yellow lines, above).
Doing a very rough calculation using the Omicron evolution of 2022, Dr. Bedford calculated a waning time of ~1.8 years, or roughly the yellow line on the above graph.
Dr. Bedford emphasizes that this is purposefully a simple model and should not be considered a prediction. I would reiterate both these points. Evolution is a random walk and our understanding of longer term CoV-2 dynamics continues to change. However, we should be prepared for the possibility that CoV-2 behaving differently than other common respiratory pathogens.
Finally, remember that you can always reduce your individual risk from CoV-2 and COVID-19 by keeping up-to-date vaccinations, focusing on ventilation, and choosing to wear a high-quality mask in at-risk situations.


